What is the US federal budget?
Steve talks about the federal budget, including how the government makes money (namely, income taxes) and how revenue collection and spending decisions impact the US federal deficit and debt, military spending, and American daily life.
Transcript
In this episode of Just the Facts, the Budget.
The federal budget is a measurement of how much our government spends and how much revenue it takes in. And the budget really took off with Covid.
In the years leading up to the pandemic, annual federal government spending hovered between $5 and $5.3 trillion dollars, adjusted for inflation. Then COVID hit in 2020 and the budget really went up to $7.7 trillion to help us through the crisis. Federal spending has exceeded $6 trillion every year since.

It’s really hard to make sense of a trillion of anything, so try thinking of it this way. If you spent $1,000 dollars every day, it would take over 16 million years to spend $6 trillion dollars.
That’s a big number.
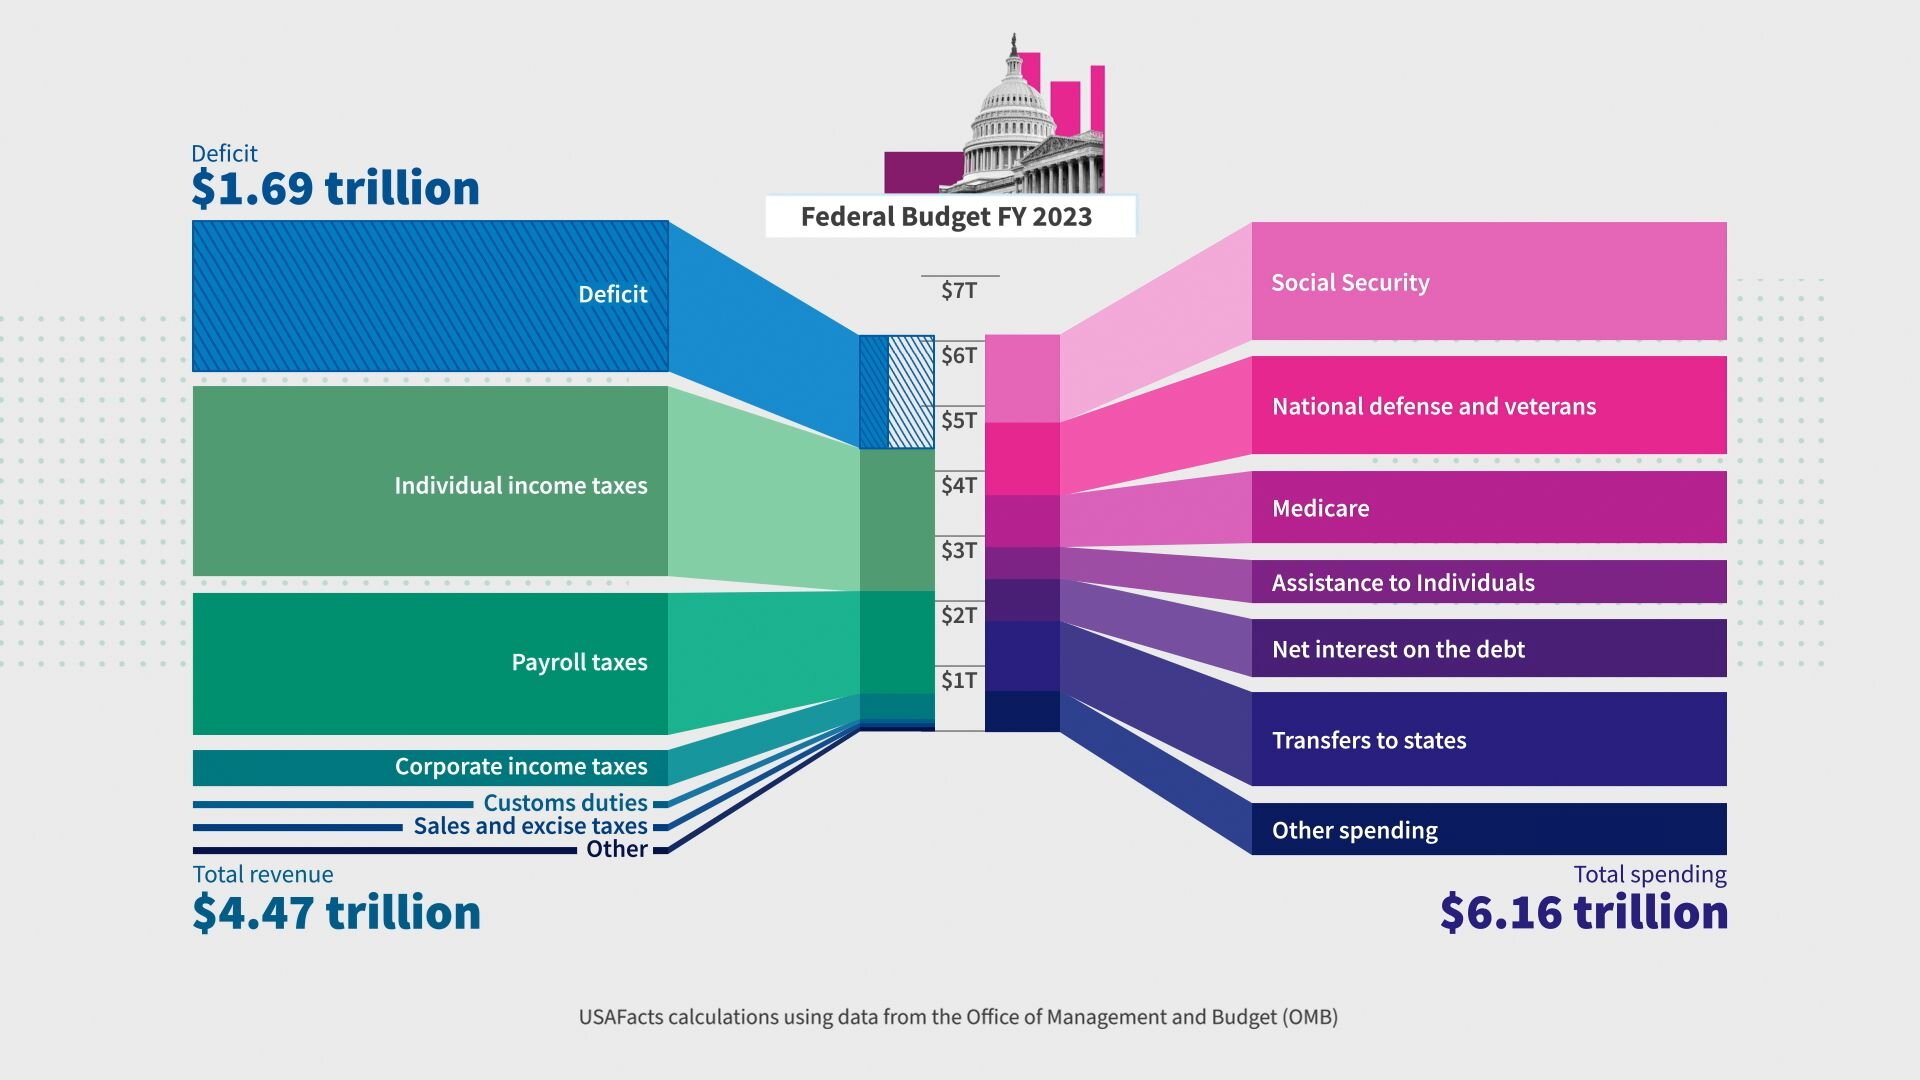
In 2023, the federal government spent less, as Covid spending went away, only $6.2 trillion dollars. But it took in $4.5 trillion of mostly tax revenue. This means our government had to come up with $1.7 trillion dollars to cover the difference between spending and revenue. In government speak — that’s our deficit.
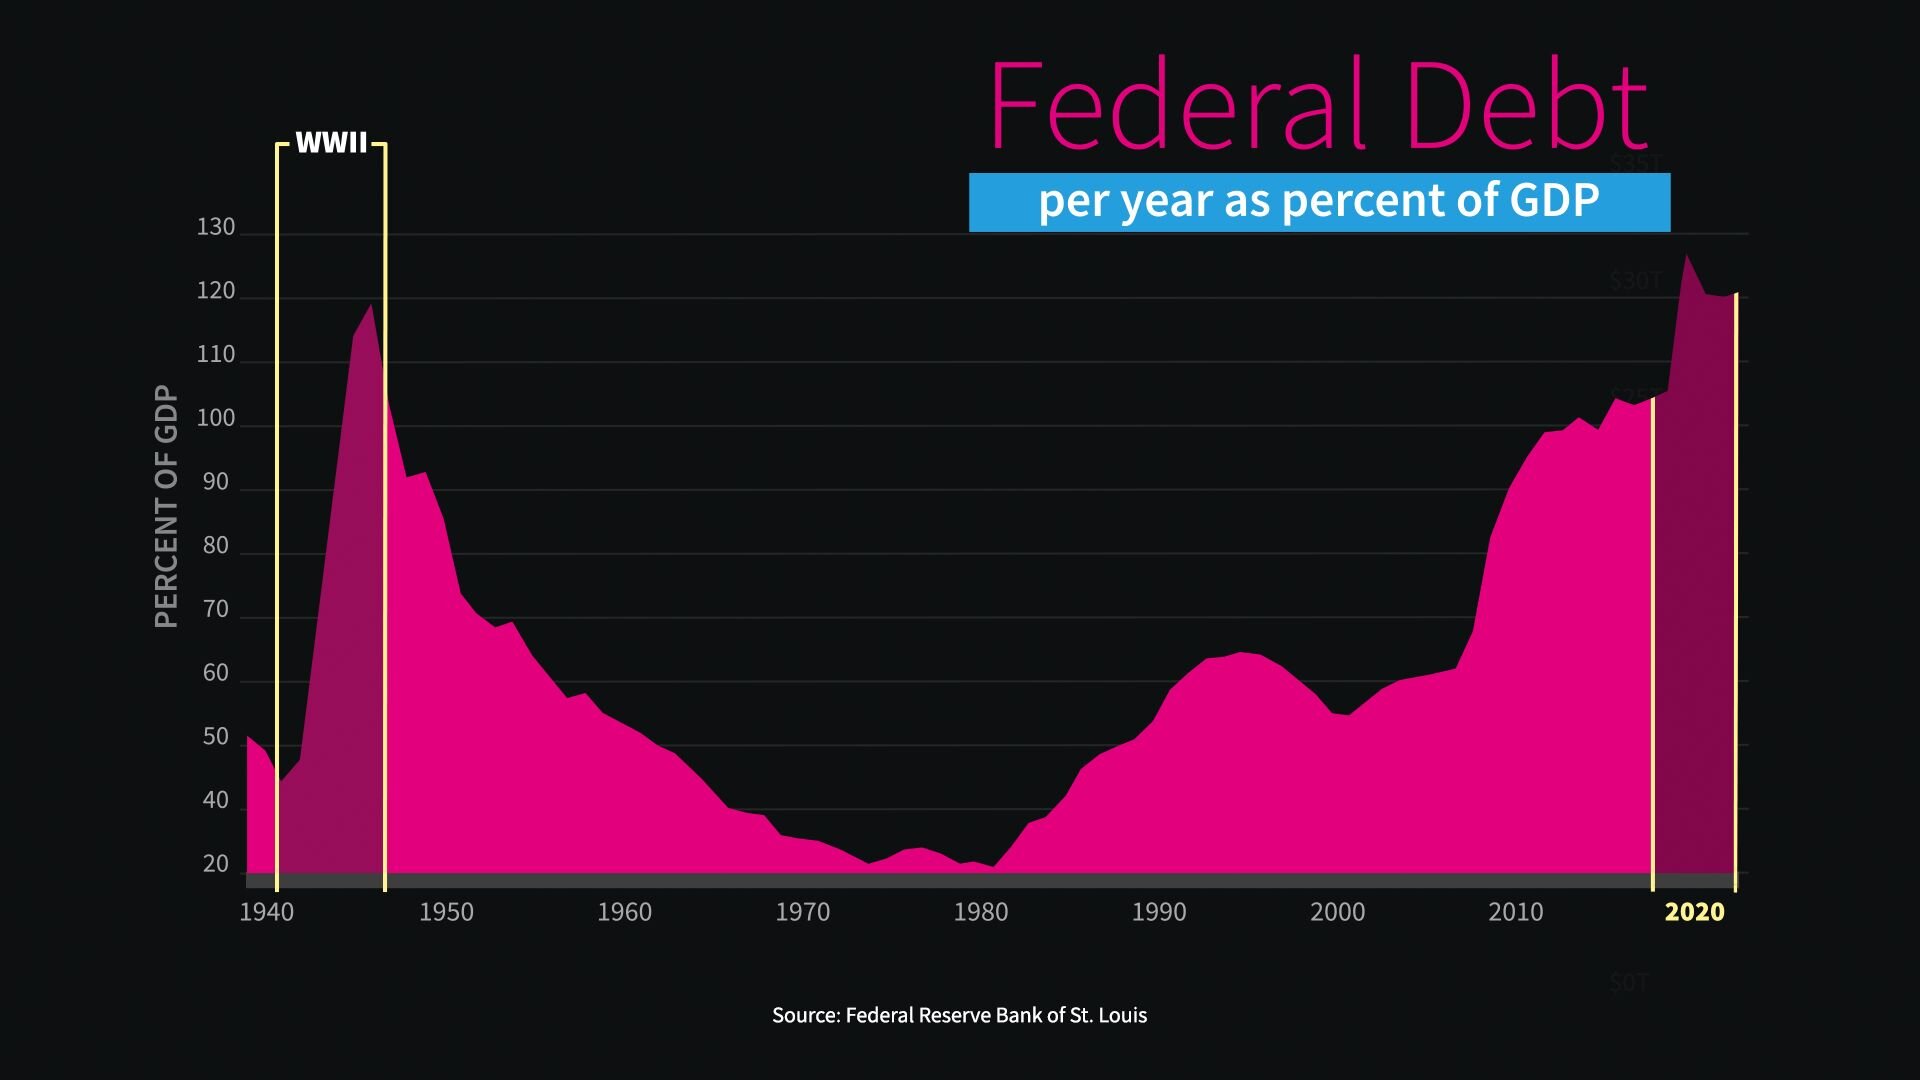
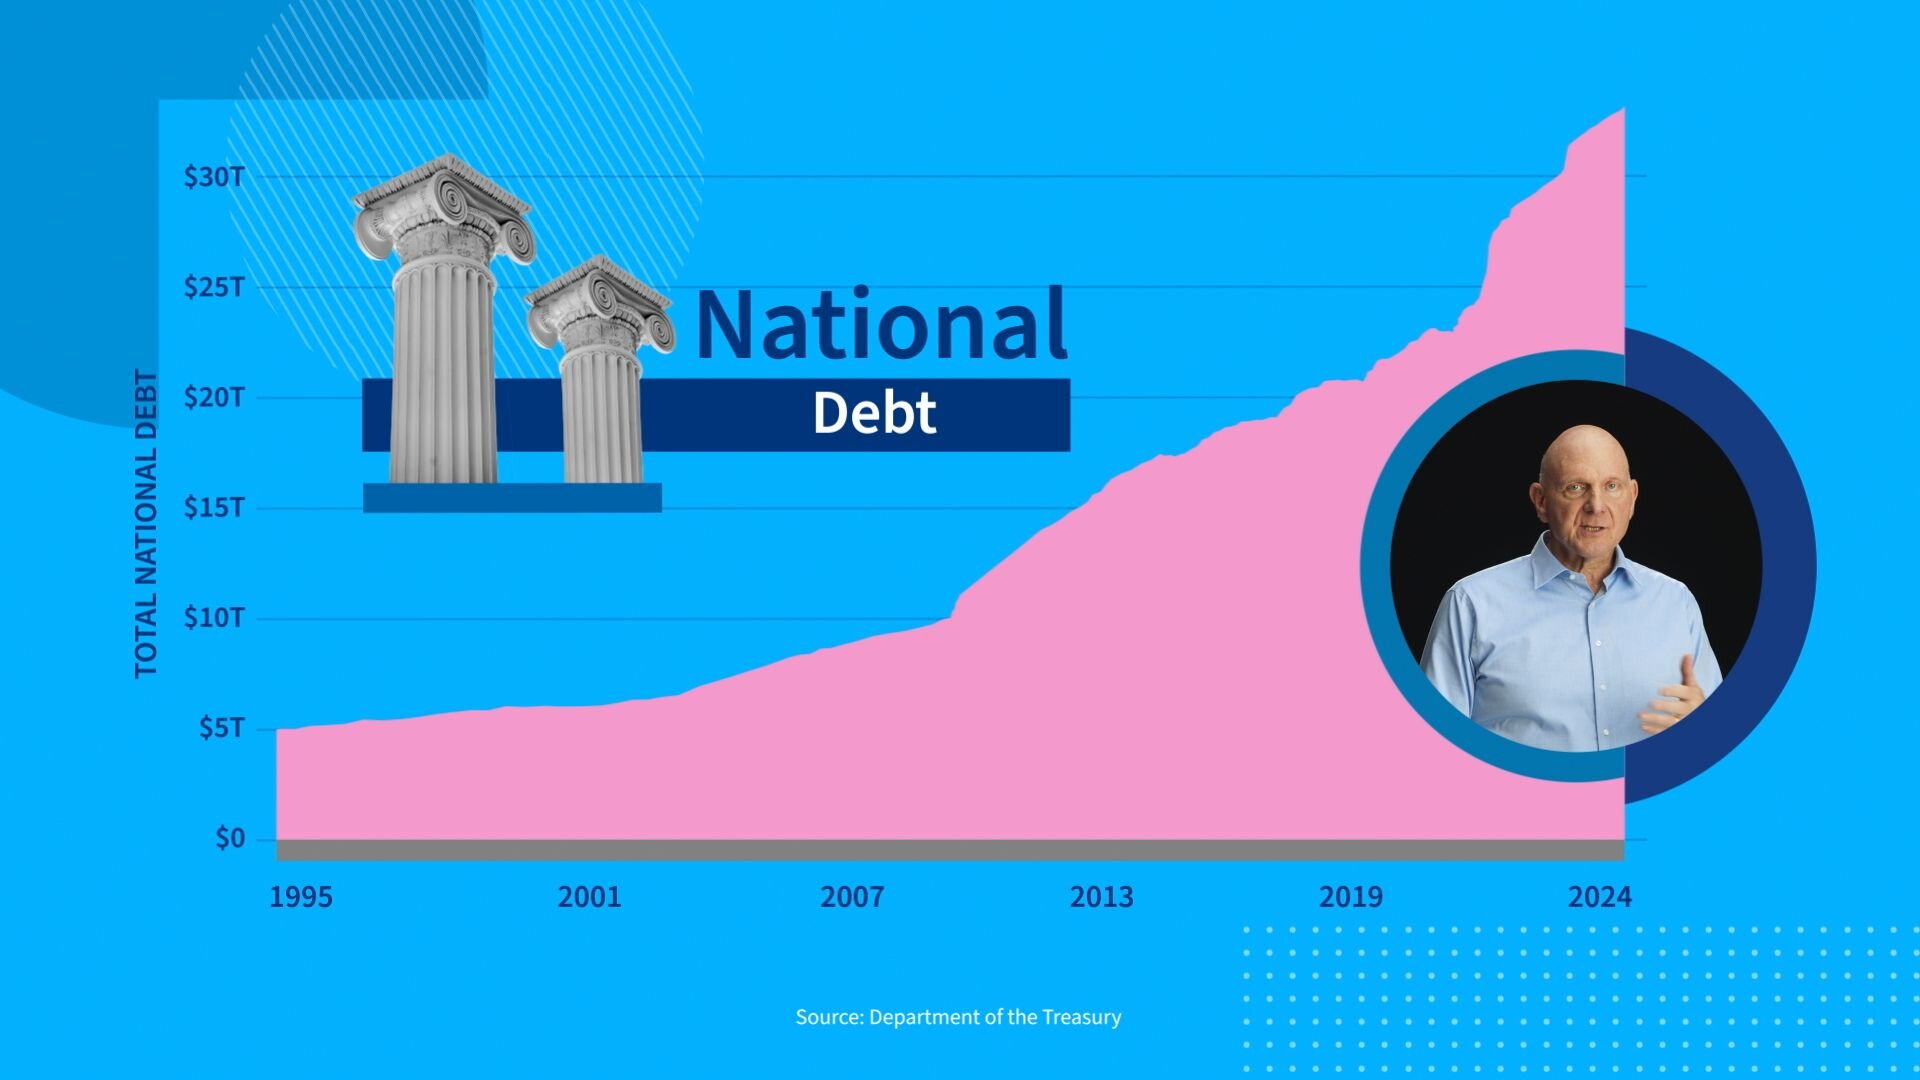
Those deficits are ultimately funded with borrowing. When you add up all the federal government’s borrowing over the years, you’re going to get close to $35 trillion dollars — which is the total national debt today — which in 2020, was the largest share of our economy as measured by our GDP at anytime since World War II.
Now let’s dive into the details, starting with the spending part of the budget.
About 60% of all federal spending is categorized as mandatory spending — which amounted to $3.8 trillion last year. This spending is essentially on autopilot because it funds programs whose eligibility rules and benefit formulas are set in law. This consists mostly of programs like Social Security, Medicare, Medicaid and Veterans care.
Then there are interest payments on our debt, which totaled $659 billion last year. We’re going to have to pay our interest on our debt. Everything else Washington does — from defense and education to transportation and scientific research — it’s all funded by what is called discretionary spending, which accounted for $1.7 trillion last year.
Let’s do a Fact Check —
Mandatory spending — $3.8 trillion. Discretionary spending $1.7 trillion. Net interest $659 billion dollars. Total spending $6.2 trillion dollars.
Now, let’s take a deeper dive into the two biggest pieces of mandatory spending: Social Security and Medicare.
Social Security has been around since 1935. It provides retirement, disability, and survivor benefits to eligible individuals.
Some key facts about the program:
It now costs about $1.4 trillion a year and accounts for 22% of the total federal budget. There are over 67 million people receiving social security and they’re getting an average benefit of about $1,900 dollars a month for the actual retirees; and about $1,500 dollars or so for the disabled and surviving spouses.
Social Security, it actually relies on payroll taxes from current workers to go into a trust fund. And then that trust fund pays out the benefits to those who receive them. With an aging population, there are projections that the Social Security Trust Fund will be exhausted by the year 2035.
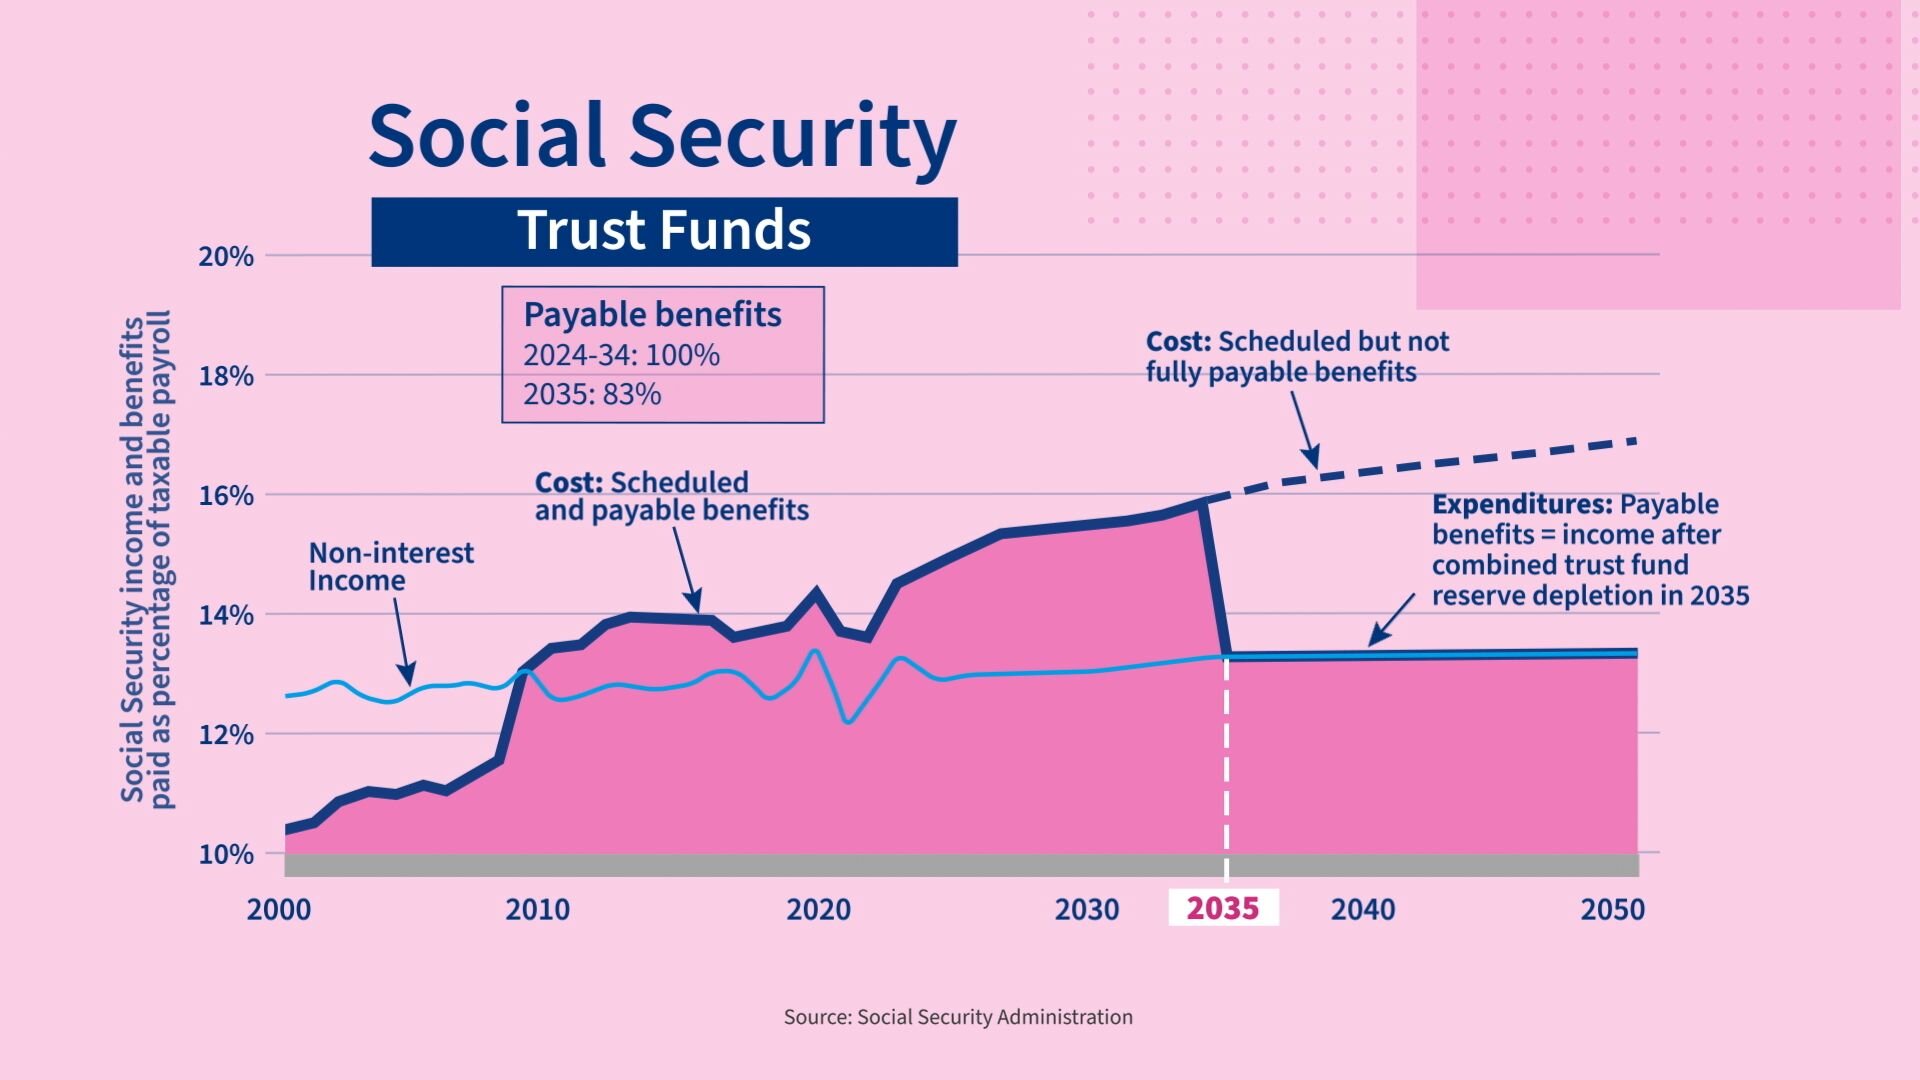
Now, projections about wherey Social Security is heading could be wrong.
As the old Yankee catcher from my youth, Yogi Berra, liked to say, “It’s tough to make predictions, especially about the future.”
Let’s talk about the second biggest mandatory spending item — which is Medicare.
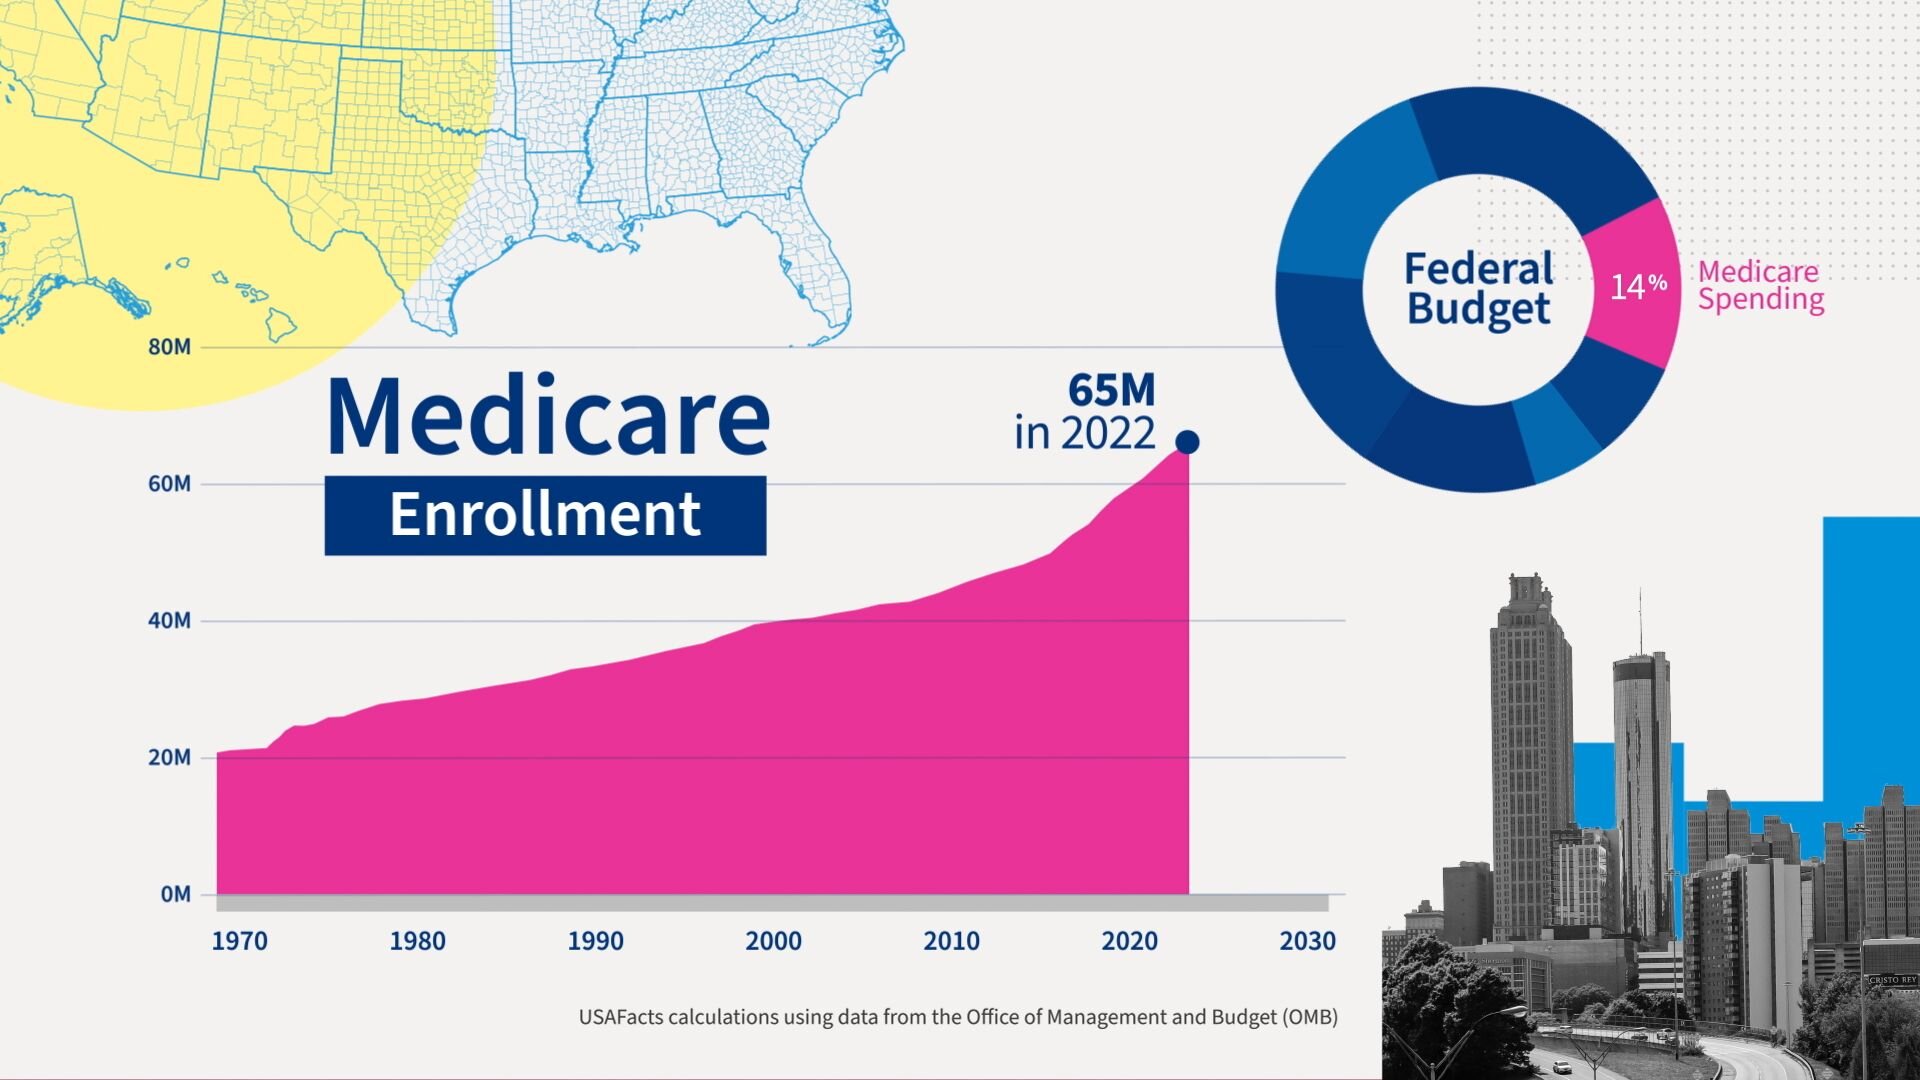
Medicare cost the federal government about $850 billion dollars in 2023 and that’s about 14% of all of our federal spending. So the bulk of the spending provides health insurance for anyone 65 and older. Today, Medicare covers 67 million Americans or about one in four adults, and in 2022, which is the most recent year released, we spend about $16,000 dollars per beneficiary per year. Medicare’s share of the federal budget has increased from 10% of the budget in 1994 to 14% as the number of enrollees in the program has continued to grow with our aging population.
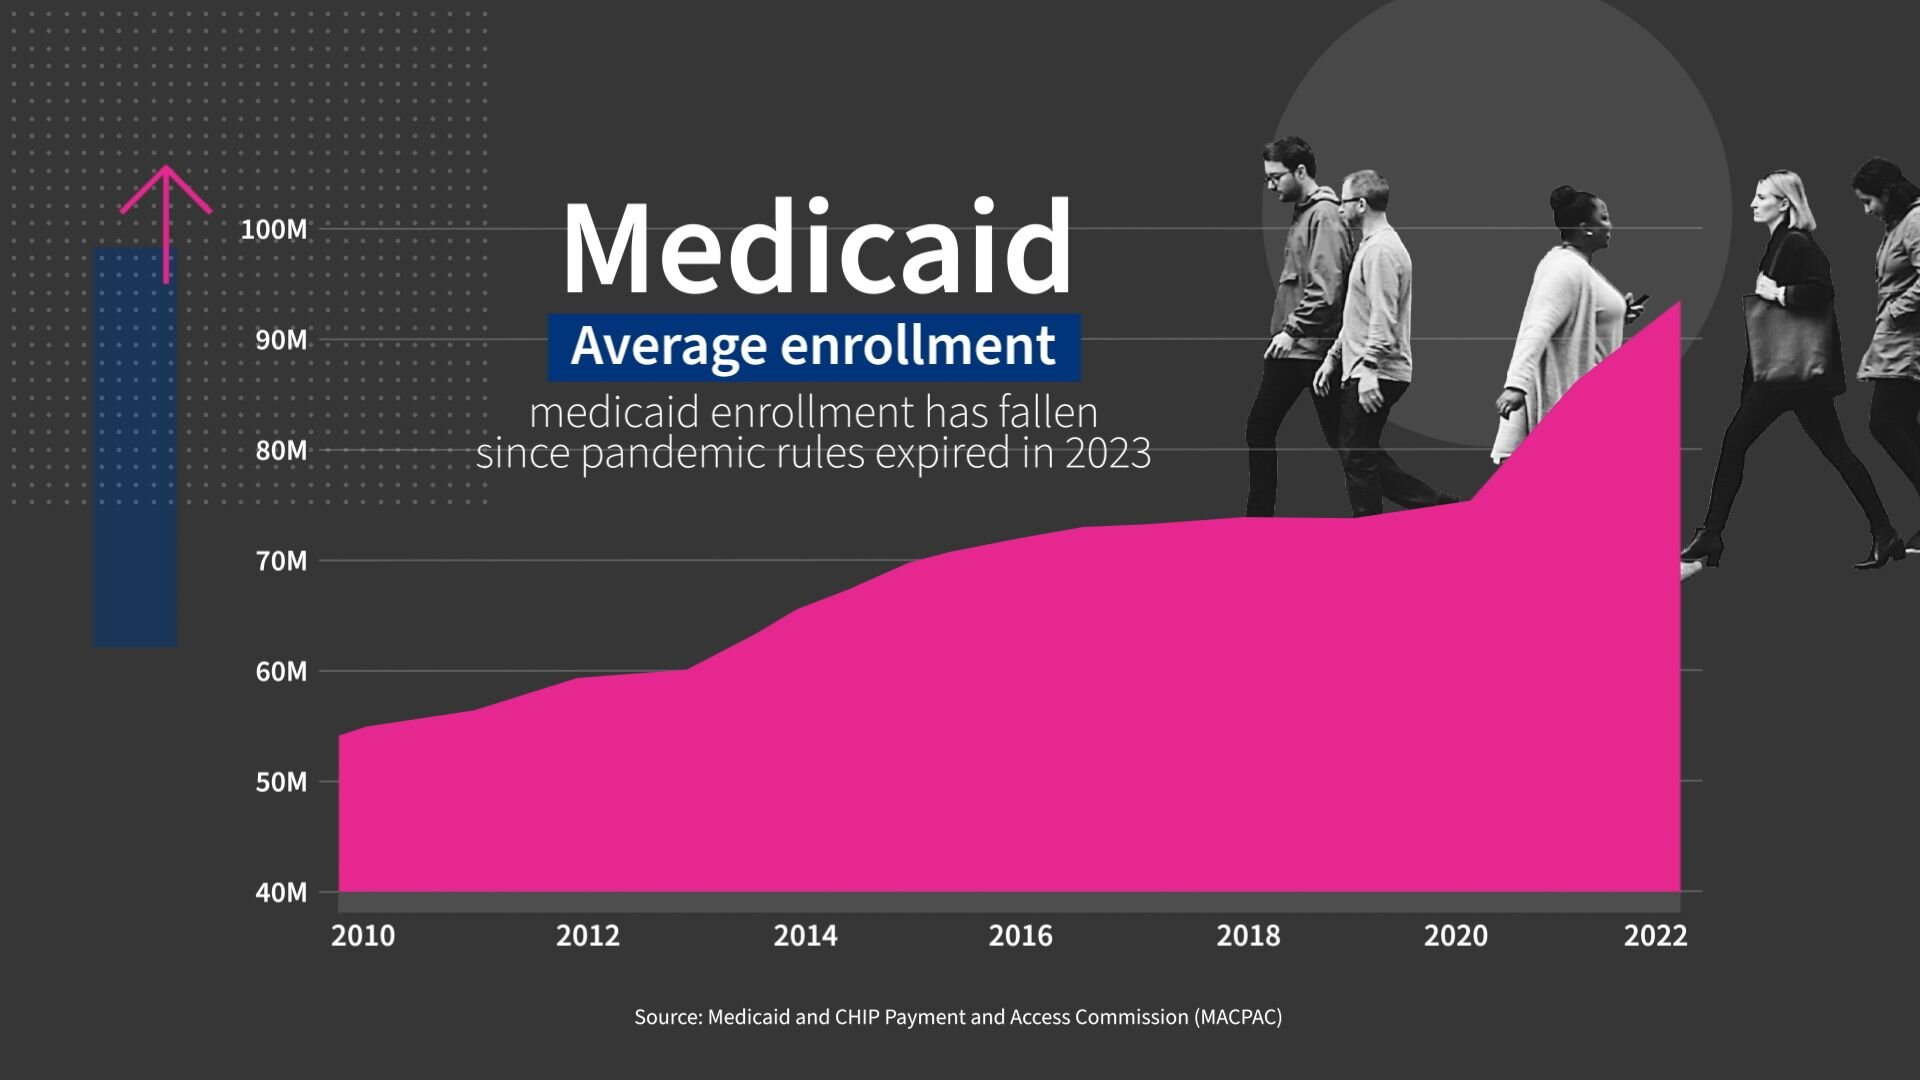
Medicaid, which is a program that provides health insurance coverage for those who can least afford it, is jointly financed by the federal and states government.
In total, the federal government, though, paid for $616 billion of it in 2023. As of December of 2023, there’s about 78 million Americans on Medicaid and enrollment for the program has grown since the passage of the Affordable Care Act in 2010.
Another line item in mandatory spending is veterans’ benefits. They amount to about $299 billion dollars (57% is mandatory).
I, for one, am really happy about the mandatory nature of benefits for our veterans.
Here’s another big ticket item.
Through a combination of mandatory and discretionary spending, Washington sent nearly $1.1 trillion dollars in grants to our states and local governments in 2023.
More than half of that was for Medicaid which we just discussed as well as some Children’s health programs. The rest of this is spend with the states is for a range of programs from education to infrastructure and also some other social programs.
National defense is the single largest category of the discretionary part of federal spending, and it came in at $820 billion dollars in 2023. The two biggest defense expenditures are salaries and benefits and maintaining and acquiring new weapons systems.
America has:
1.3 million active-duty service members in the Army, Navy, Marines, Air Force, Coast Guard and elsewhere.
We have 767,000 people in the reserves — these are people in civilian jobs who do regular training, though, for the military and can be called into active duty in the future;
And 779,000 are civilians that are filling various support roles in the military. I actually had no idea we had so many civilians doing important work for our military.
America has also 16 million veterans, a number that is declining. In 1990, about 11% of the population were veterans while today it’s about 6%.

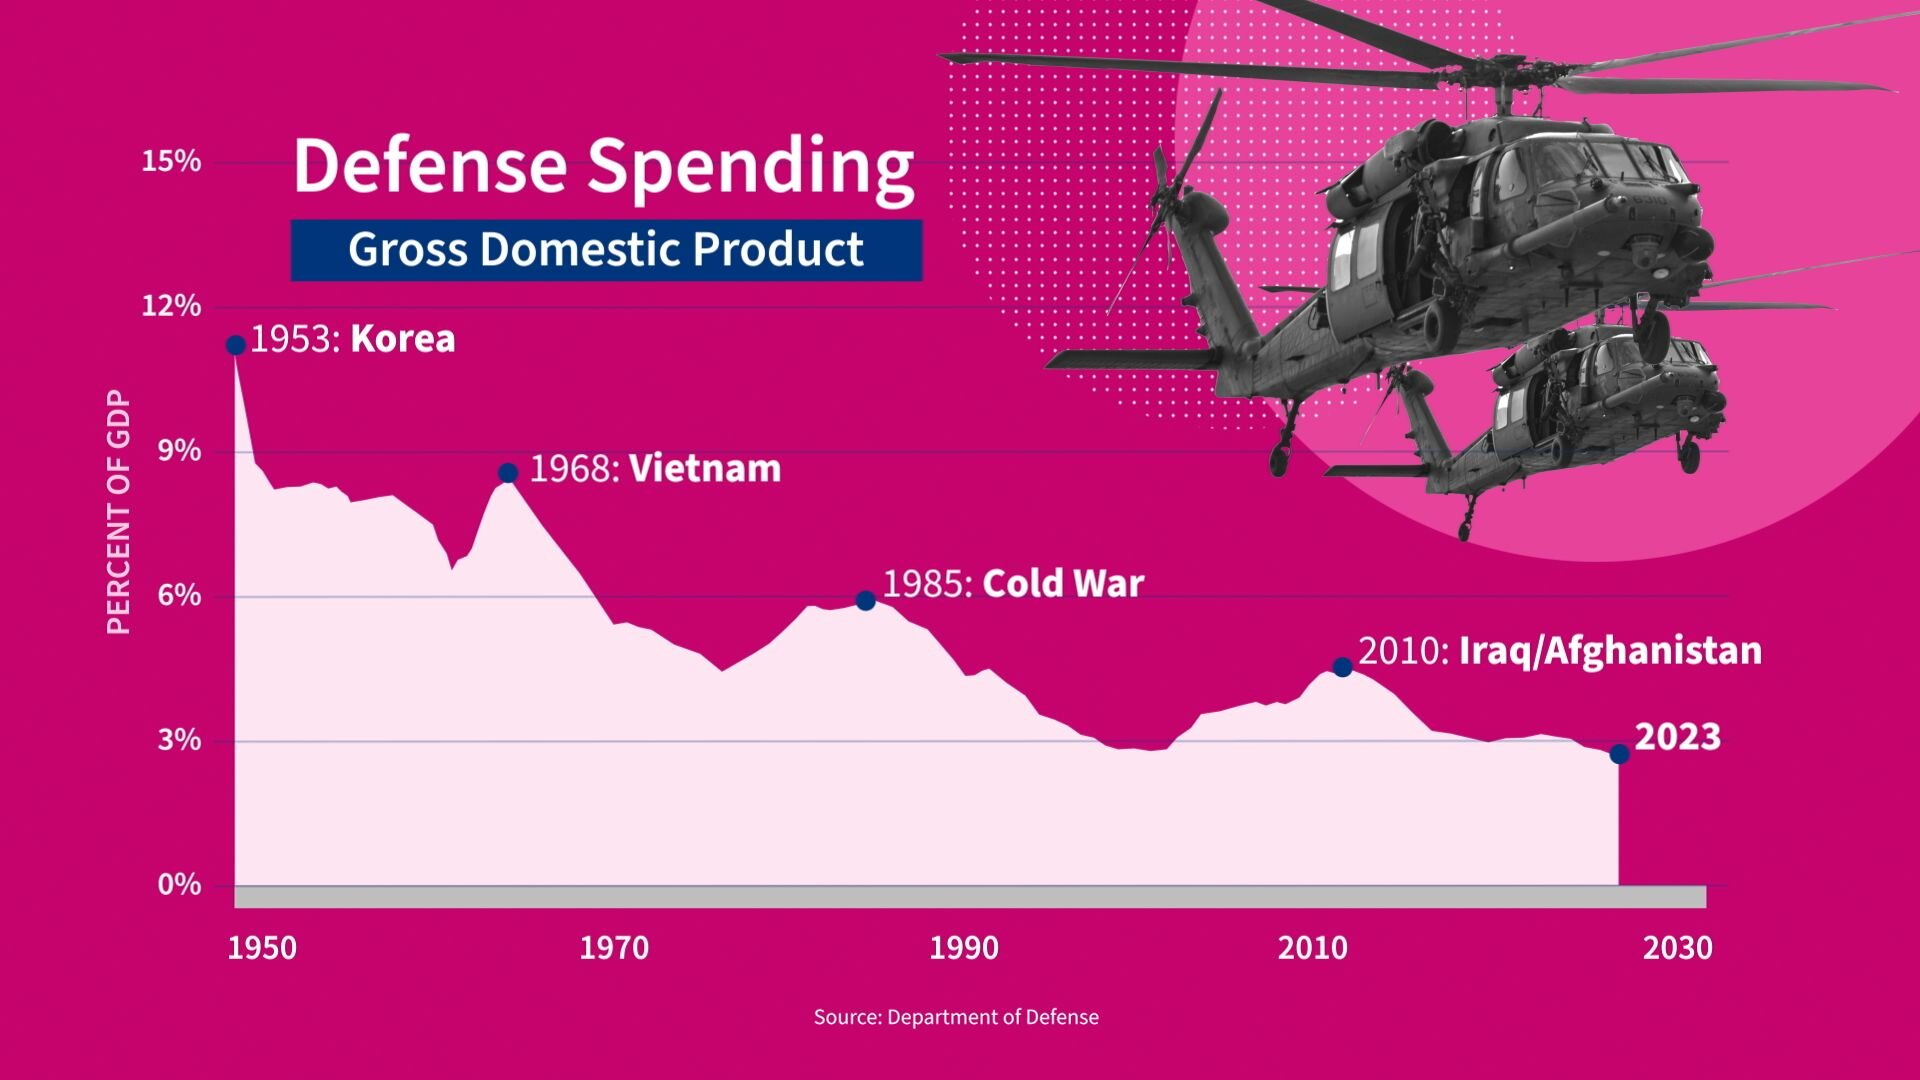
Finally, as a share of American GDP, defense spending is about 3%, that’s the lowest it’s been since the data started being published around the Korean War.
When you combine all federal mandatory spending with discretionary defense spending and our interest payments, that accounts for 86% of the 2023 federal spend.
The remaining 14% is discretionary spending and it covers the rest of the federal government, from payments to farmers, food safety, environmental protection, the Administration of Justice and more.
Some bills signed in the last few years will also impact our budget.
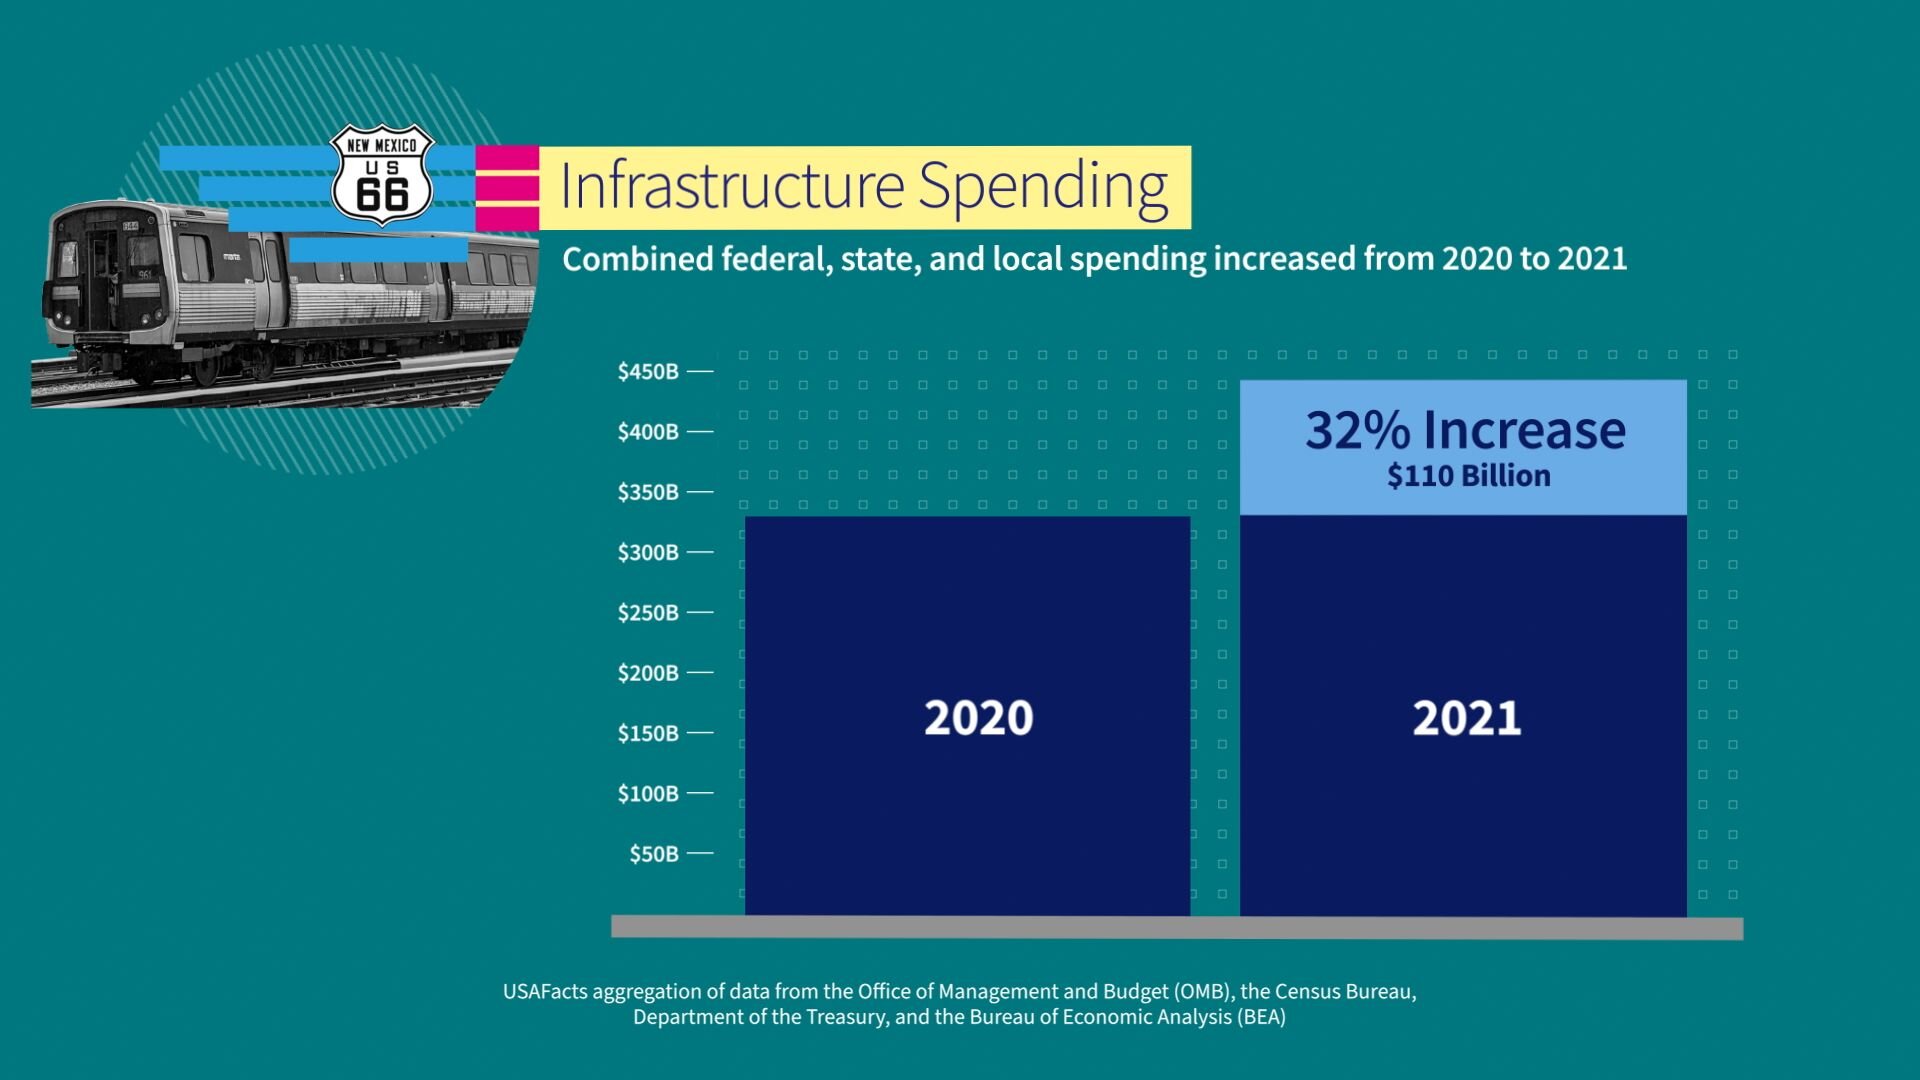
The 2021 Infrastructure and Jobs Act will inject an additional $110 billion dollars on average per year through 2026 into public works priorities like roads, bridges, water and broadband. That’s a 32% increase over the 2021 combined federal, state and local spending in those areas. However, the exact funds are not evenly distributed each year and are still being allocated.
Now let’s look at where the money comes from.
$4.4 trillion out of our $4.5 trillion of federal government revenue came from taxes. Of the taxes collected in 2023: $2.2 trillion, or 49% were from individual income taxes, which are the taxes that are paid on income from salary, commissions, fees, tips, capital gains, dividends, retirement income and more; $1.6 trillion dollars, which is 37% of the revenue, came from payroll taxes; and another $420 billion, or 9%, came from corporate income taxes.
So those are the big revenue streams. The federal government does get money from other sources including another $80 billion from customs duties and $76 billion dollars from sales and excise taxes, which are taxes on goods like alcohol, gas, cigarettes.
Let’s take a closer look at individual income taxes and who pays them:
The top five percent of earners, who made a minimum of about $253,000 dollars paid $1.4 trillion dollars of tax, or close to 66% of all income taxes collected in 2021, while the top 10%, who made at least $170,000 dollars, paid $1.7 trillion or almost 76% of all income tax.
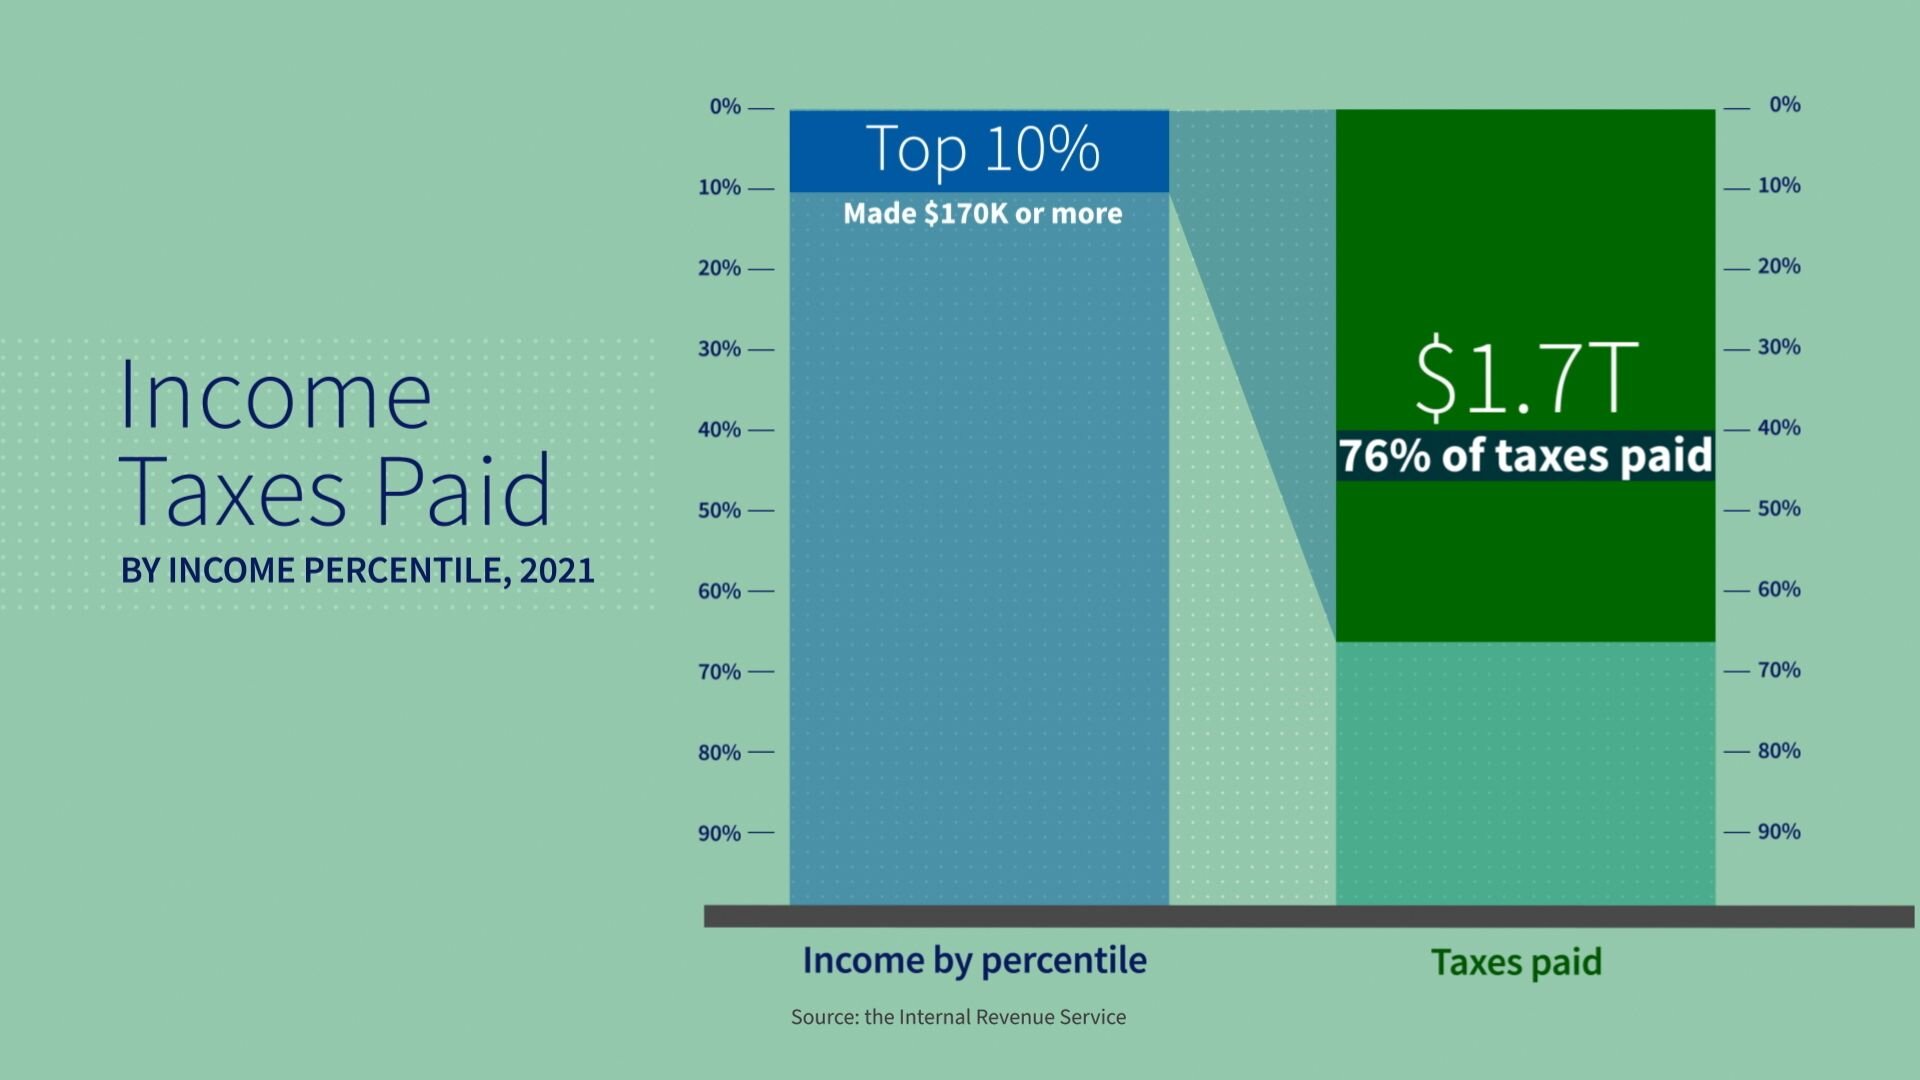
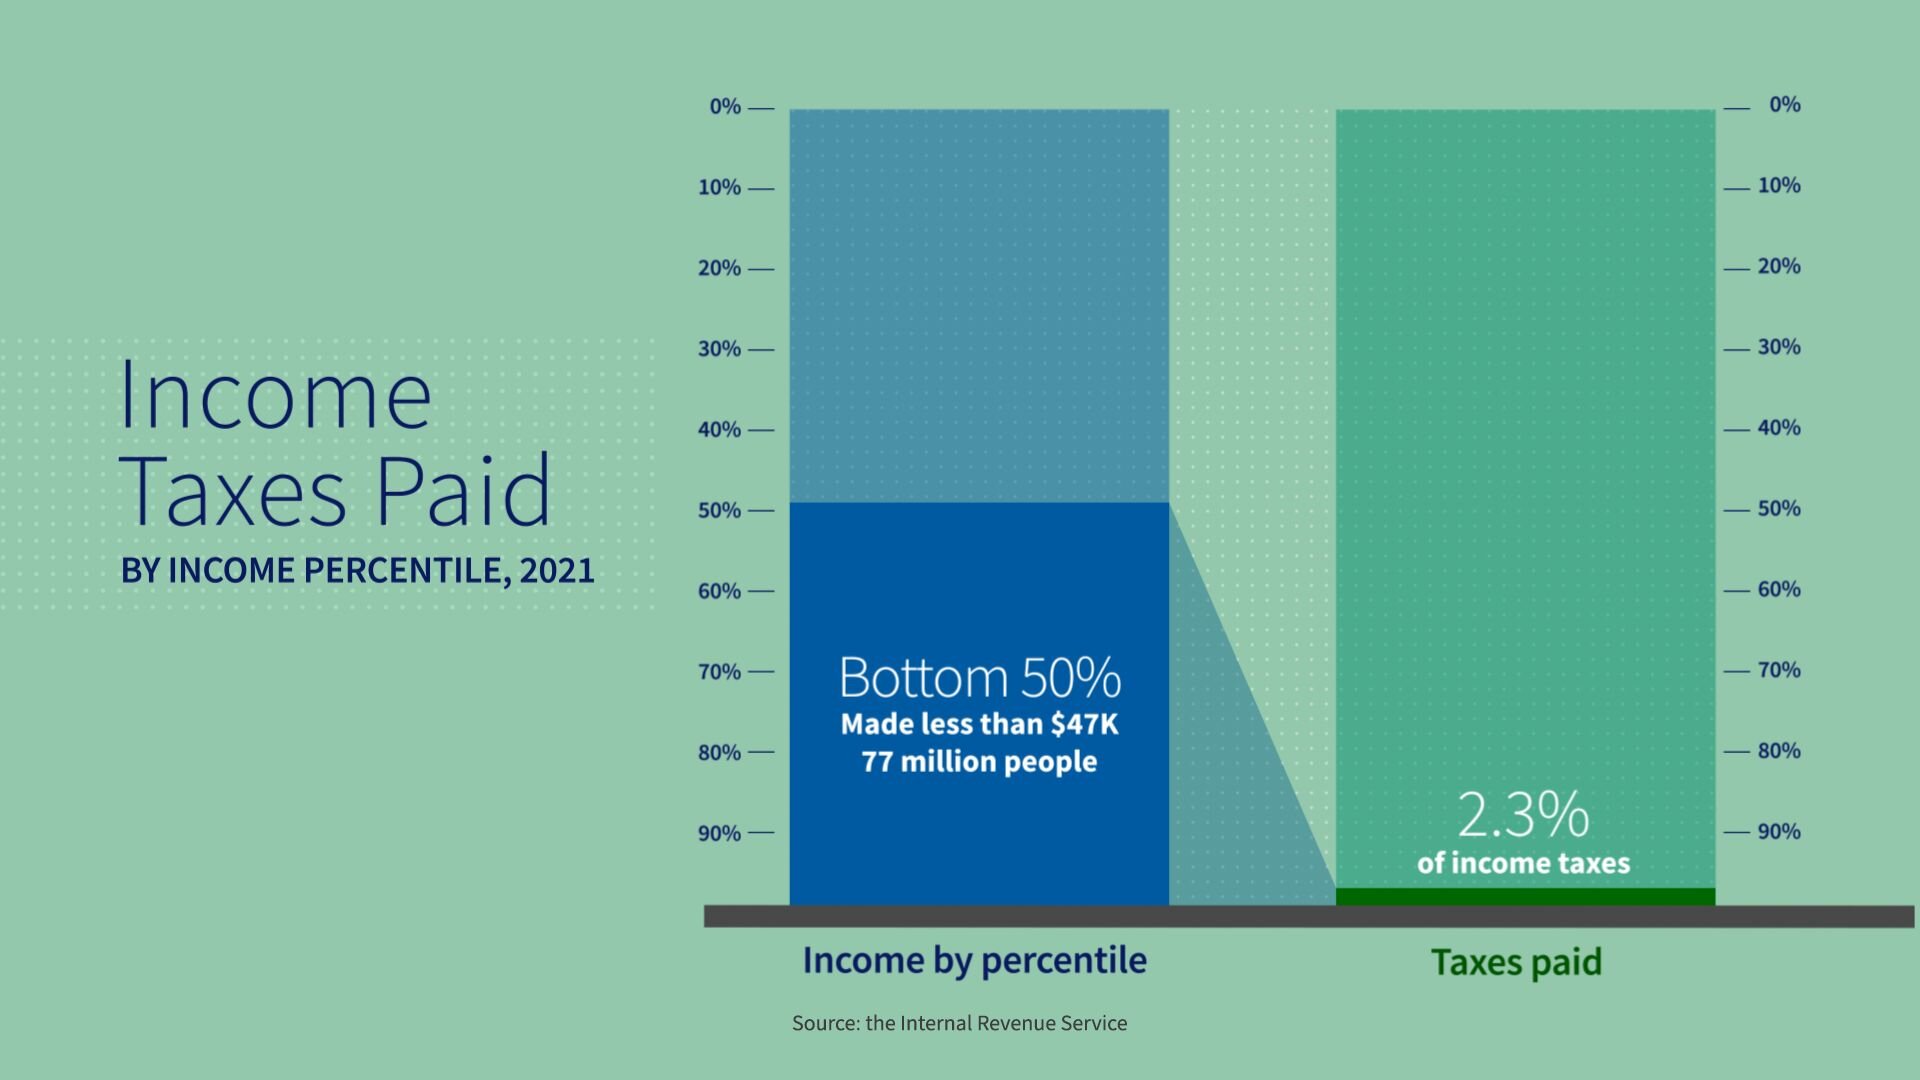
The bottom 50% of filers, who made less than $46,637 dollars — which is 77 million people — paid 2.3% of all income taxes but, just to remember, people do pay into Social Security and Medicare via payroll taxes and they are also subject to various state and local taxes and of course sales taxes as part of that.
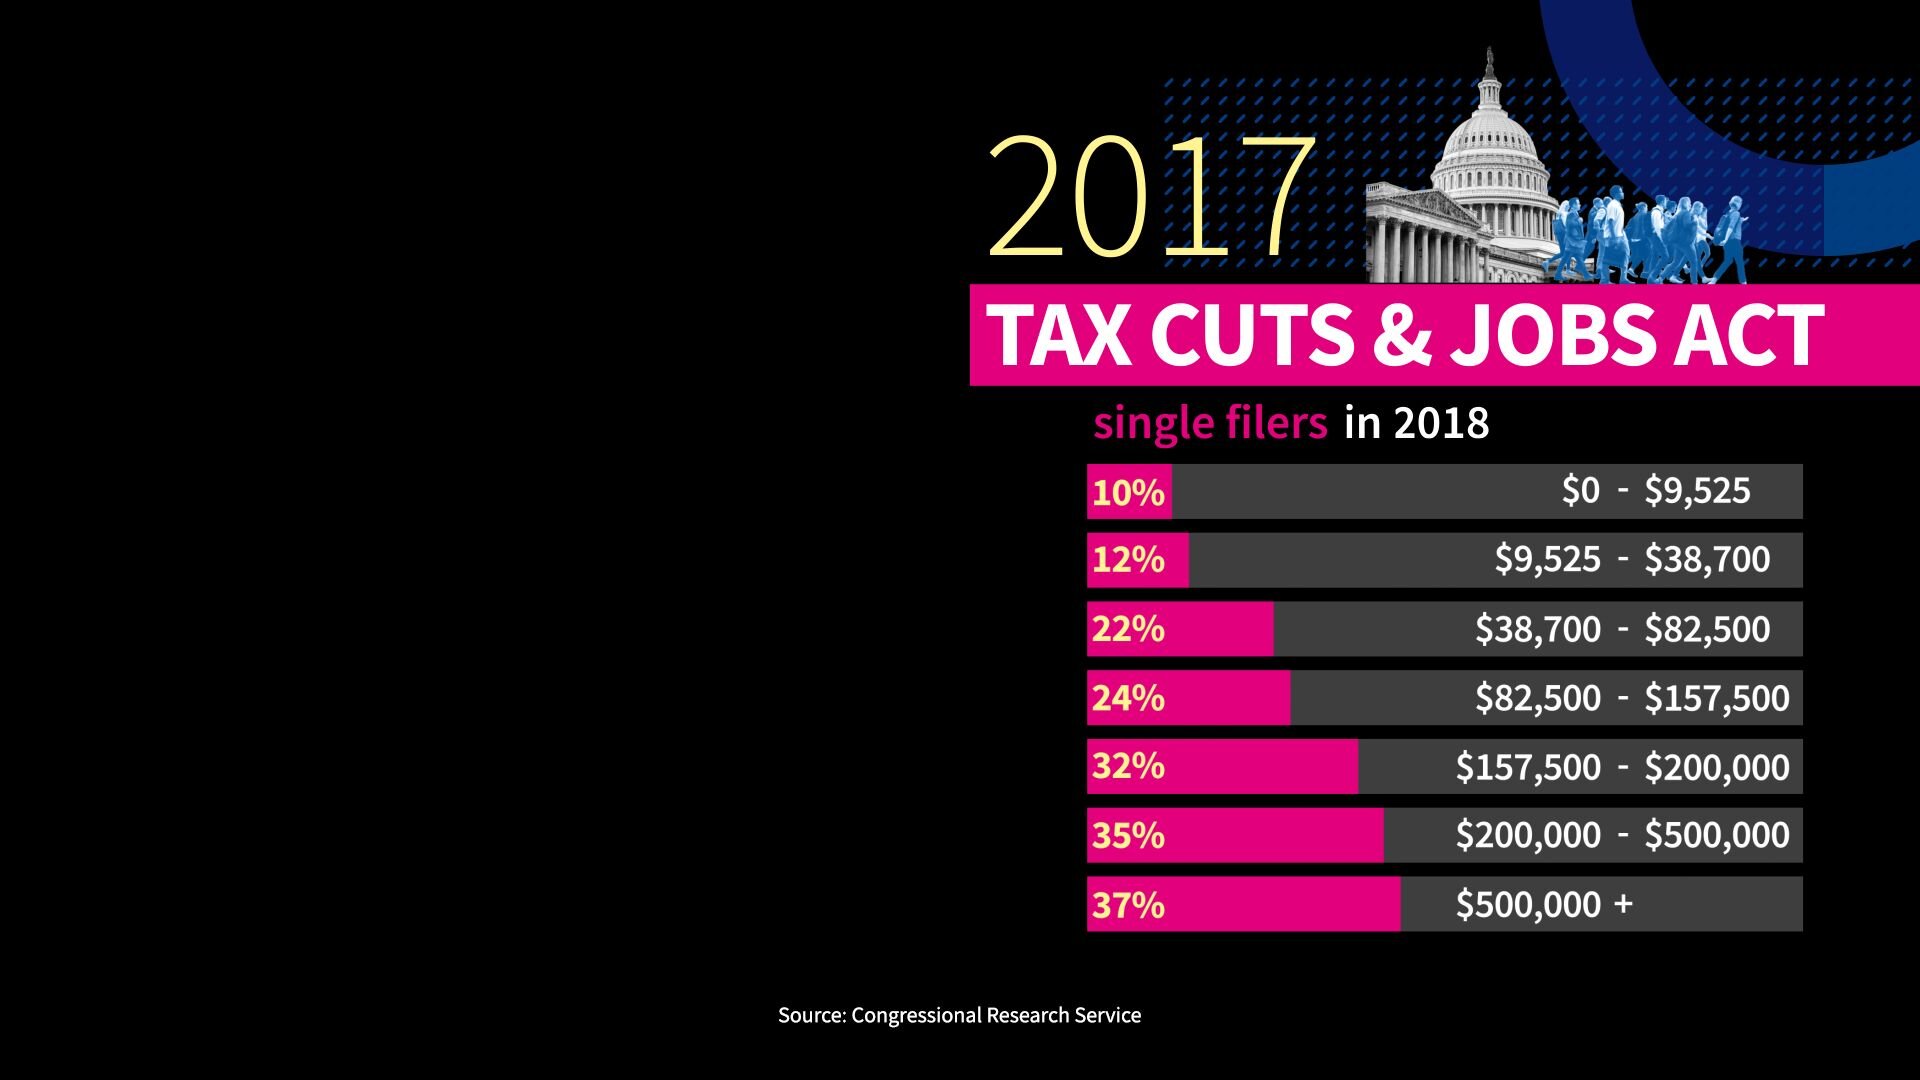
In 2017, Congress passed, and President Trump signed the Tax Cut and Jobs Act. That lowered individual rates for every tax bracket and increased the tax credit for each child to $2000 dollars. Most of that $2000 dollars is refundable, which means you receive cash back even if you don’t owe federal taxes.
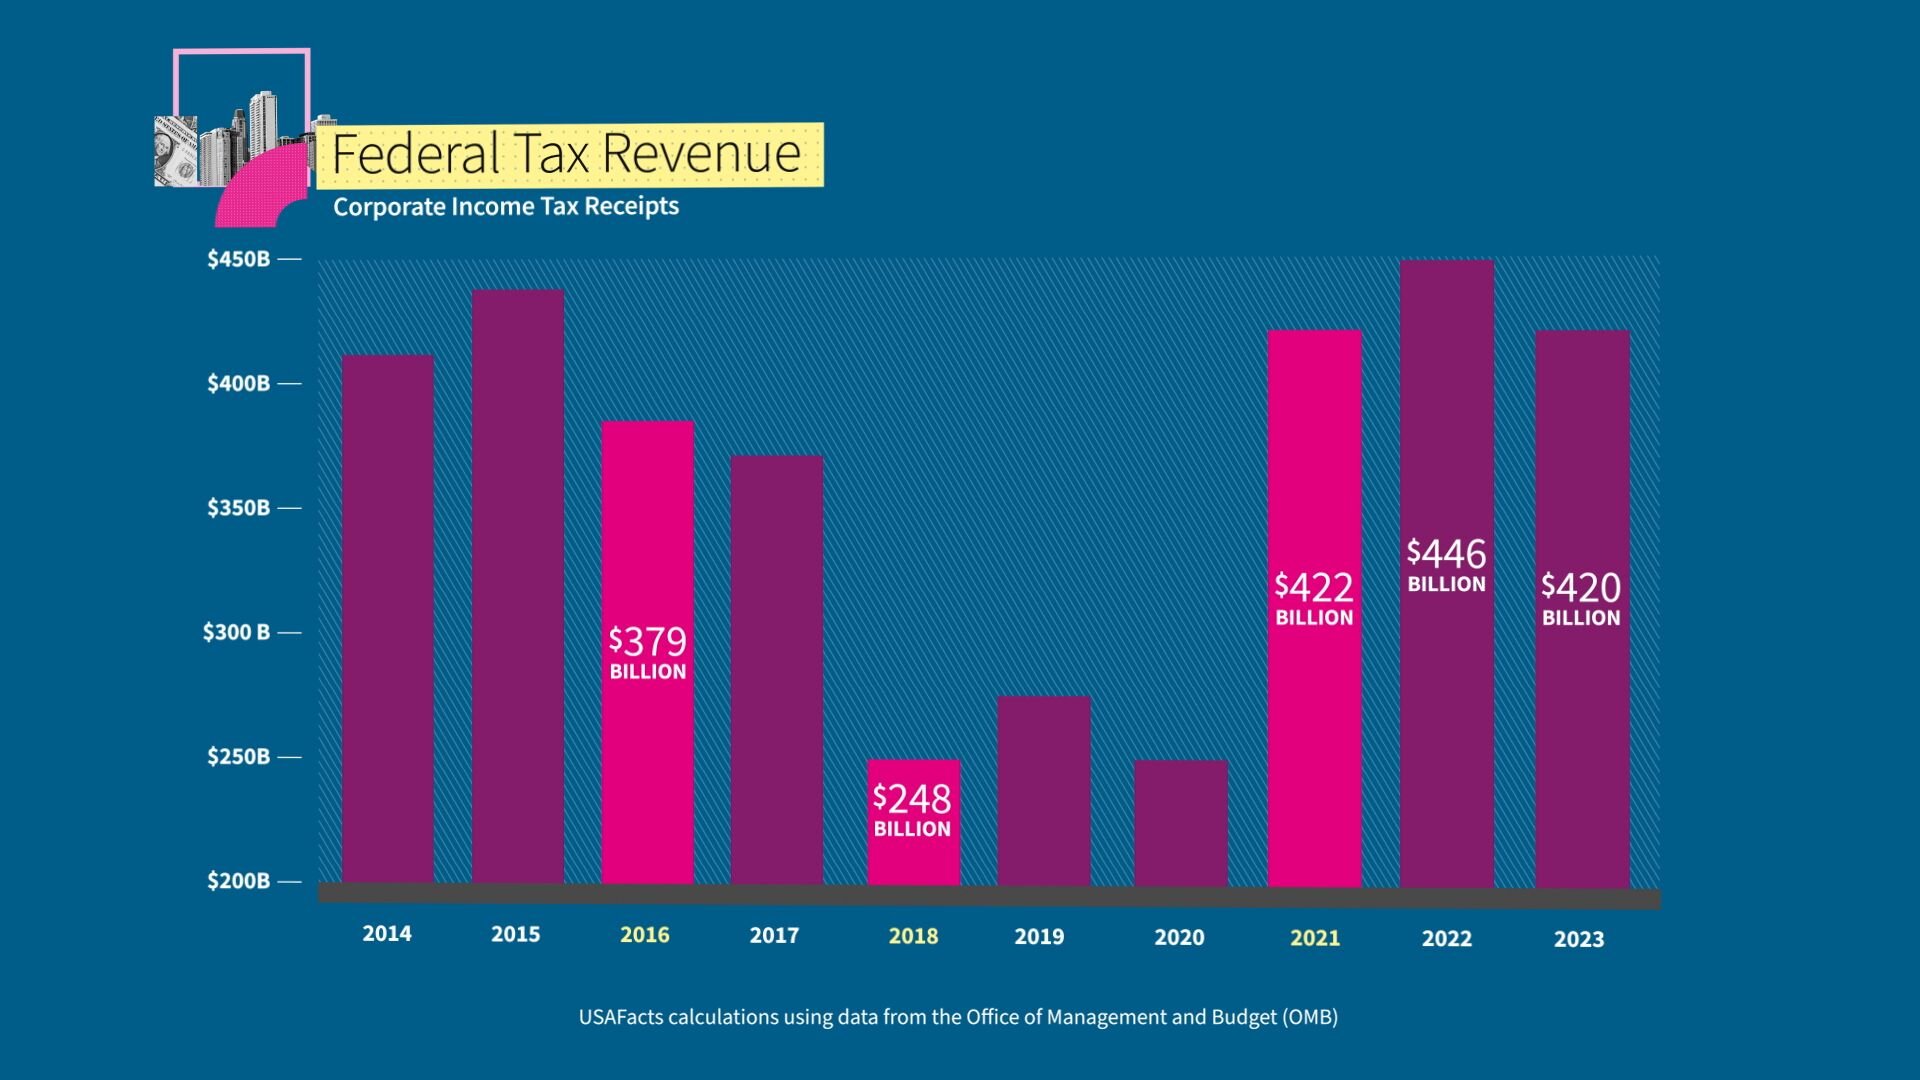
The bill also cut the corporate income tax rate from 35% to 21%.
Now, adjusted for inflation, tax revenue from companies went from $379 billion in 2016 to $248 billion in 2018 and $422 billion by 2021.
There’s a key thing to note though. At the end of 2025, the individual tax cuts expire, they go away, while the corporate tax cuts do remain in place.
Let’s do a Fact Check.
The federal government spent $6.2 trillion dollars last year. And it took in nearly $4.5 trillion in revenue. That leaves a deficit of $1.7 trillion dollars just for 2023.
I’m going to let you know my personal view on this. I do worry about the size and especially the growth in our debt.
In the last 15 years alone, Washington has added another $24 trillion dollars to our total debt. And the interest the government pays on that debt has gone up just like it has for millions of Americans. Now that may not sound like much, but it’s billions of dollars more every year.
America still has the largest and most vibrant economy in the world and that has sustained us so far. But in my view, if we don’t have our fiscal house in order, it could all unwind. Now you may or may not agree with me. That’s really not the point. You have data now to help you start thinking about these issues. And, of course, we’ll have to see what the presidential candidates have to say about the matter.
That’s it for the Federal Budget — thanks for hanging in there.
I hope you agree — the more we know, the better voters we can be.
Just the Facts from USAFacts: you decide what you believe.
Leave a Reply
You must be logged in to post a comment.